How to Use WordPress Debug Mode to Fix Site Errors

On this page
Want this handled for you?
Get startedHow do you use WordPress debug mode to find an error?
WordPress debug mode turns a blank screen into an exact file and line number. Here’s how to switch it on safely, read debug.log and turn it off again.
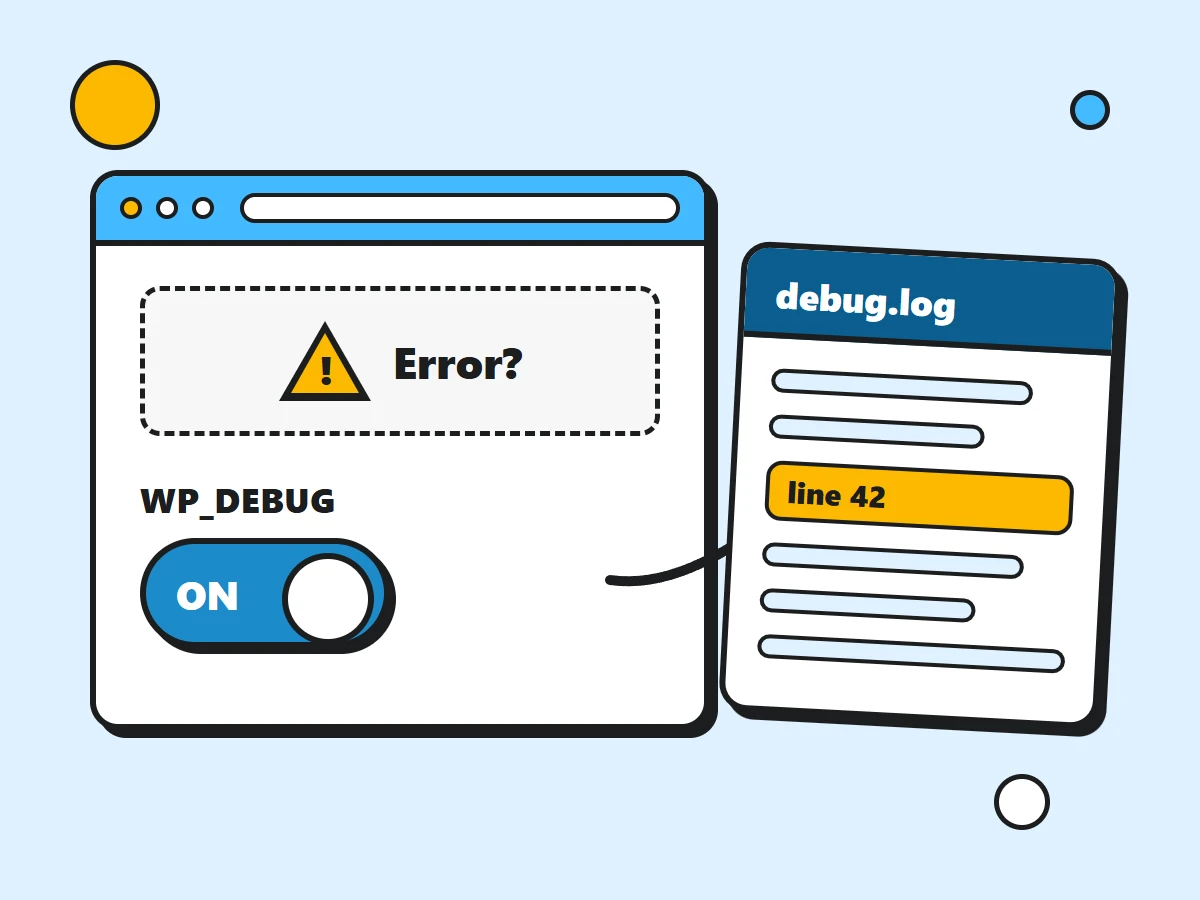
WordPress debug mode makes your site tell you what’s wrong instead of hiding it. You switch it on with a few lines in wp-config.php, reproduce the problem, then read the exact error, file and line number in a log. It’s the fastest way to go from “the site is broken” to “this plugin, this line”, and you don’t need to be a developer to use it.
What WordPress debug mode actually does
By default, WordPress keeps PHP errors quiet. That’s the right choice for a live site: visitors shouldn’t see file paths and warnings. But it also means that when something breaks, you get a blank page, a half-loaded layout or the message “There has been a critical error on this website”, with no clue about the cause.
WordPress debug mode changes that. It’s controlled by a handful of PHP constants in wp-config.php, the configuration file in your site’s root folder. The main one, WP_DEBUG, tells PHP to report every error, warning, notice and deprecation message. The others decide where those messages go: to a log file, to the screen, or both.
WordPress debug mode doesn’t fix anything by itself. It’s a diagnostic tool, like a check-engine light that also prints the fault code. Once you know which plugin, theme or custom snippet is failing, the fix is usually simple: update it, roll it back, replace it or ask its developer.
Before you touch wp-config.php
wp-config.php holds your database details and the settings WordPress loads first. A missing semicolon or stray quote here can take the whole site down, so a minute of preparation is worth it.
- Back up the file first. Download a copy to your computer, or duplicate it on the server as
wp-config-backup.php. If anything goes wrong, you put the original back and the site returns. A full site backup is even better if you have one handy. - Use SFTP or your host’s file manager. An SFTP client (such as FileZilla) or the file manager in your hosting control panel lets you open the file directly. Avoid editing it through a plugin from inside WordPress: if the edit breaks the site, you may lose access to the very tool you used.
- Use a plain-text editor. Word processors swap straight quotes for curly ones, which PHP can’t read. The built-in editor in most file managers, or any code editor, is fine.
- Prefer a staging copy if the problem shows up there too. Debugging on a copy means visitors never notice.
Open wp-config.php and scroll down until you see this line, or one very like it in older installs:
/* That's all, stop editing! Happy publishing. */Everything you add goes above that line. Below it, WordPress loads wp-settings.php, and constants defined after that point arrive too late to have any effect. Also check that WP_DEBUG isn’t already defined further up: many hosts add define( 'WP_DEBUG', false ); by default. Change that line rather than adding a second one, because defining the same constant twice triggers a warning of its own.
The official wp-config.php reference lists every constant the file accepts, if you want to see what else lives in there.
Turn on WordPress debug mode with WP_DEBUG
The switch itself is one line:
define( 'WP_DEBUG', true );Save the file and reload the page that shows the problem. On a development site, errors now appear right on the page. On a live site, that’s exactly what you don’t want: visitors would see raw PHP messages, sometimes including server paths. So on any site people can visit, never use WP_DEBUG alone. Pair it with logging and hide the on-screen output, as in the next step.
Comfortable with the command line? WP-CLI can set the constant without opening the file: wp config set WP_DEBUG true --raw. The --raw flag writes true as a PHP boolean instead of the text 'true'.
Send errors to a log with WP_DEBUG_LOG
This is the setup to use on a live site. Errors go quietly into a file that only you read, and visitors see nothing different:
define( 'WP_DEBUG', true );
define( 'WP_DEBUG_LOG', true );
define( 'WP_DEBUG_DISPLAY', false );
@ini_set( 'display_errors', 0 );
Here’s what each line does:
WP_DEBUG_LOGset totruewrites every message towp-content/debug.log. WordPress creates the file the first time something is logged.WP_DEBUG_DISPLAYset tofalsestops WordPress printing errors into the page. Its default istrue, which is why turning onWP_DEBUGalone shows errors on screen.@ini_set( 'display_errors', 0 );is a belt-and-braces line. Some server setups display errors regardless of what WordPress asks, and this tells PHP directly to keep them off the page.
Write the log to a custom path
The default location has one big drawback: wp-content is publicly reachable, so anyone who guesses /wp-content/debug.log can read your log. Since WordPress 5.1, WP_DEBUG_LOG also accepts a file path instead of true:
define( 'WP_DEBUG_LOG', '/home/youruser/logs/wp-errors.log' );Point it at a folder outside your public web root, so it can’t be opened in a browser at all. Use the full server path (your host’s file manager or control panel usually shows it), and make sure PHP can write to that folder. If no file appears after you reproduce the error, permissions are the usual reason.
Now go back to the broken page, or repeat whatever triggers the problem: save the post, submit the form, load the checkout. The aim is to make the error happen at least once while logging is on.
Read debug.log and understand the messages
Open the log in your file manager or download it over SFTP. Each entry starts with a timestamp, then the type of message, then the details. A typical line looks like this:
[29-Oct-2026 10:14:07 UTC] PHP Fatal error: Uncaught Error: Call to undefined function example_helper() in /home/youruser/public_html/wp-content/plugins/example-plugin/inc/setup.php:42Read it from right to left and it tells you everything: the file path names the plugin (example-plugin), the number after the colon is the line, and the text before it is what went wrong. Start with the newest entries at the bottom, and match their timestamps to when you reproduced the problem. With WordPress debug mode on, fatal errors often add a long stack trace; the first few lines matter most.
The messages fall into a few families:
- PHP Fatal error. Execution stopped. This is the one behind white screens and “critical error” messages. Common causes are a plugin calling a function that no longer exists, a plugin that needs a newer PHP version, two plugins declaring the same function, or “Allowed memory size of … bytes exhausted”, which means the page ran out of memory. Fatal errors are always worth fixing.
- PHP Warning. Something went wrong, but the page carried on. Since PHP 8, many slips that used to be notices, such as an undefined variable or array key, are reported as warnings. They can cause odd behaviour, like a missing value in a form or a broken layout.
- PHP Notice. Minor issues that rarely break anything. WordPress also logs its own notices, such as “Function … was called incorrectly”, when a plugin uses a WordPress function the wrong way. Recent versions report plugins that load translations too early this way. Mostly harmless; pass them on to the developer.
- PHP Deprecated. The code still works today but uses something scheduled for removal, either from PHP or from WordPress (“… is deprecated since version … Use … instead”). Not urgent, but it’s an early warning that a future update could turn it into a fatal error.
A busy log can hold hundreds of notices from perfectly healthy plugins. Search for Fatal first, then for warnings that name the plugin or theme linked to your symptom. If you want the noise gone from a live site for good, our guide on how to hide PHP warnings and notices in WordPress covers that side of things.
Once you’ve found the culprit, the usual fixes are: update the plugin or theme, roll back to the version that worked, deactivate it and look for an alternative, or check whether your PHP version matches what the plugin requires. If the path points to your theme’s functions.php, a recently added snippet is the likely cause.
Use SCRIPT_DEBUG and SAVEQUERIES for harder problems
Two more WordPress debug mode constants help when the log stays clean but something still misbehaves.
SCRIPT_DEBUG
define( 'SCRIPT_DEBUG', true );WordPress normally loads minified versions of its own CSS and JavaScript files. SCRIPT_DEBUG makes it load the full, readable development versions instead. That helps when the block editor won’t load, a button in the dashboard does nothing, or the browser console shows a JavaScript error you need to trace. Error messages from readable files point to meaningful lines rather than one long squashed line. Note that this applies to WordPress core files; plugins and themes only follow it if their developers built them to.
SAVEQUERIES
define( 'SAVEQUERIES', true );SAVEQUERIES records every database query on each page load, how long it took and which function ran it, in the $wpdb->queries array. It’s useful when a page is slow and you suspect a plugin is hammering the database. On its own, it only stores the data; you need a tool to display it. The free Query Monitor plugin on WordPress.org shows queries, PHP errors and hooks in a panel in the admin bar, and is the easiest way to look at this information.
Both constants slow your site down a little, and SAVEQUERIES uses noticeably more memory on busy pages. Turn them on only while you’re investigating. If slowness is the real problem rather than an error, our speed optimisation service is built for exactly that.
WordPress debug mode constants at a glance
Each constant answers a different question, which is why you’ll usually combine two or three.
| Constant | What it does | Safe on a live site? |
|---|---|---|
WP_DEBUG | Reports all PHP errors, warnings, notices and deprecations | Only with display off |
WP_DEBUG_LOG | Writes messages to wp-content/debug.log or a custom path | Yes, briefly; use a private path |
WP_DEBUG_DISPLAY | Shows errors on the page (default true) | No, set it to false |
SCRIPT_DEBUG | Loads unminified core CSS and JavaScript | Briefly; slightly slower |
SAVEQUERIES | Records every database query for inspection | Briefly; uses extra memory |
Check the recovery mode email and Site Health
Before you dig into WordPress debug mode, you may not even need to open wp-config.php. WordPress has two built-in tools that often point at the problem first.
The recovery mode email
Since WordPress 5.2, when a plugin or theme causes a fatal error, WordPress shows visitors the “critical error” message and emails the site’s admin address. The email names the plugin or theme that failed, includes the error details, and contains a special link that logs you into recovery mode. In recovery mode, the faulty extension is paused for you only, so you can reach the dashboard and deactivate or update it while the public site stays as it is.
Check your inbox and spam folder for this email before anything else. If it never arrives, your site may not be sending mail reliably, or the admin address under Settings → General may be out of date. You can send these emails to a different address by defining RECOVERY_MODE_EMAIL in wp-config.php. The recovery link expires after a while, so act on it promptly.
Site Health
Go to Tools → Site Health. The Status tab flags problems such as an outdated PHP version, inactive plugins and failed background updates, and it also warns you when debug mode is left on in a risky way, for example when errors are displayed to visitors or logged to a public file. The Info tab lists your WordPress, PHP and server versions, active plugins and theme, and the state of the debug constants. That’s handy when you share details with a developer. WordPress.org explains every check on its Site Health screen page.
Turn WordPress debug mode off when you’re done
Once the problem is fixed, switch WordPress debug mode back off. Either delete the lines you added, or set them to false:
define( 'WP_DEBUG', false );Remove SCRIPT_DEBUG and SAVEQUERIES too, then delete the debug.log file itself. Leaving it on causes three real problems:
- Information leaks. A log in
wp-contentis readable by anyone who requests/wp-content/debug.log, and bots look for it. It can reveal server paths, plugin names and versions, database table names, and sometimes snippets of user data. That’s a map for an attacker. - Disk space. On an active site with noisy plugins, the log grows every day. Left alone for months, it can reach a size that fills your hosting quota.
- Performance. Logging every notice, loading full-size scripts and recording queries all add work to each page load.
If you need to keep logging on for a while to catch an intermittent fault, use a custom path outside the web root, as in step 2. On Apache servers you can also block the default file with a rule in the .htaccess file in your site’s root folder:
<Files "debug.log">
Require all denied
</Files>
Nginx servers ignore .htaccess, so there the custom path is the safer route. Either way, set yourself a reminder to switch it off. The WordPress handbook’s page on debugging in WordPress has the full list of debug constants if you want to go deeper.
The bottom line
WordPress debug mode turns a vague “something’s broken” into a precise file and line number. Back up wp-config.php, add your constants above the “stop editing” line, log to a private file with display turned off, reproduce the error and read the newest entries. Check the recovery mode email and Site Health along the way, and turn everything off when you’re done. If you’d rather someone else did the digging, our WordPress maintenance and support service handles errors like these every week.
Frequently asked questions
Yes, if you log to a file and keep display off: set WP_DEBUG_DISPLAY to false and send the log to a private path. Never show errors to visitors, and turn debug mode off as soon as you’ve found the problem.
By default it’s wp-content/debug.log, created the first time an error is logged. If WP_DEBUG_LOG holds a file path instead of true, the log is written there.
Usually because no error has happened since you turned logging on, so reproduce the problem first. Other causes: the constants sit below the “stop editing” line, WP_DEBUG is defined twice, or PHP can’t write to the folder you chose.
Not urgently. They mean code still works but uses something due to be removed. Keep the plugin or theme updated and mention the notice to its developer, since a future PHP or WordPress version may turn it into a real error.
Yes. Every Jompom plan includes core, plugin and theme updates, cloud backups, uptime monitoring and security scans, and fixes are done by a WordPress expert, with a report for every task. See the plans.